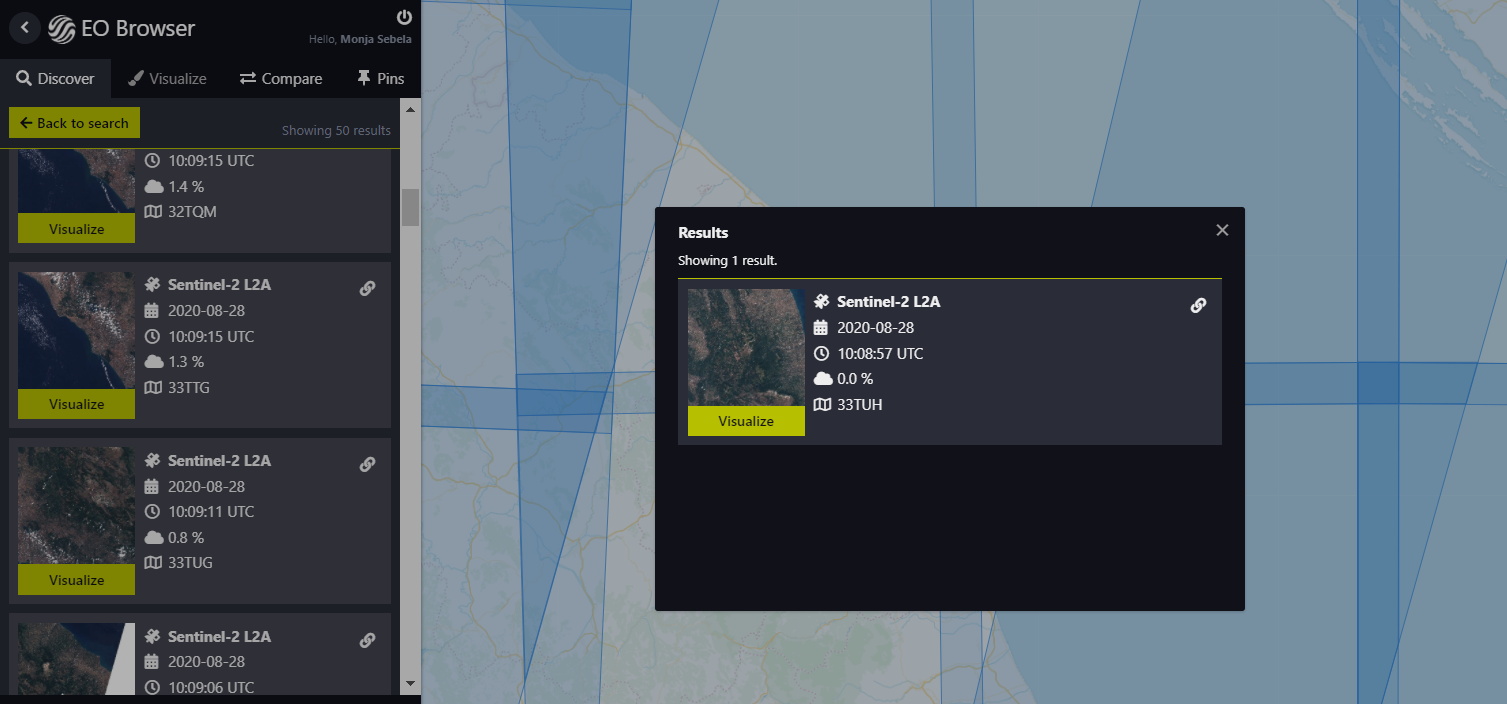
EO Browser makes it possible to browse and compare full resolution images from all the data collections we provide. You simply go to your area of interest, select your desired time range and cloud coverage, and inspect the resulting data in the browser. Try out different visualizations or make your own, download high resolution images and create timelapses.
Sentinel Hub services are providing long-term analysis in an efficient way. Some of the most exciting new EO Browser features are collected in our Medium blog posts from March 2020, July 2020, August 2021, February 2022 and August 2022.
Webinar Showcase Video User Guide Tutorials Planetary Variables
Explore EO Data
EO Browser allows you to visualize satellite data from numerous satellites and data collections instantly. The process in the background takes care of the selection of appropriate scenes, download and processing of data, as well as mosaic creation. Browsing satellite data has never been so easy!
To make it even more exciting, we have prepared a special education mode of EO Browser, where you can explore 12 unique themes, with the selected locations of interest and chosen visualizations. This EO content is perfect for students and teachers or anyone interested to explore satellite data.
Custom Visualization
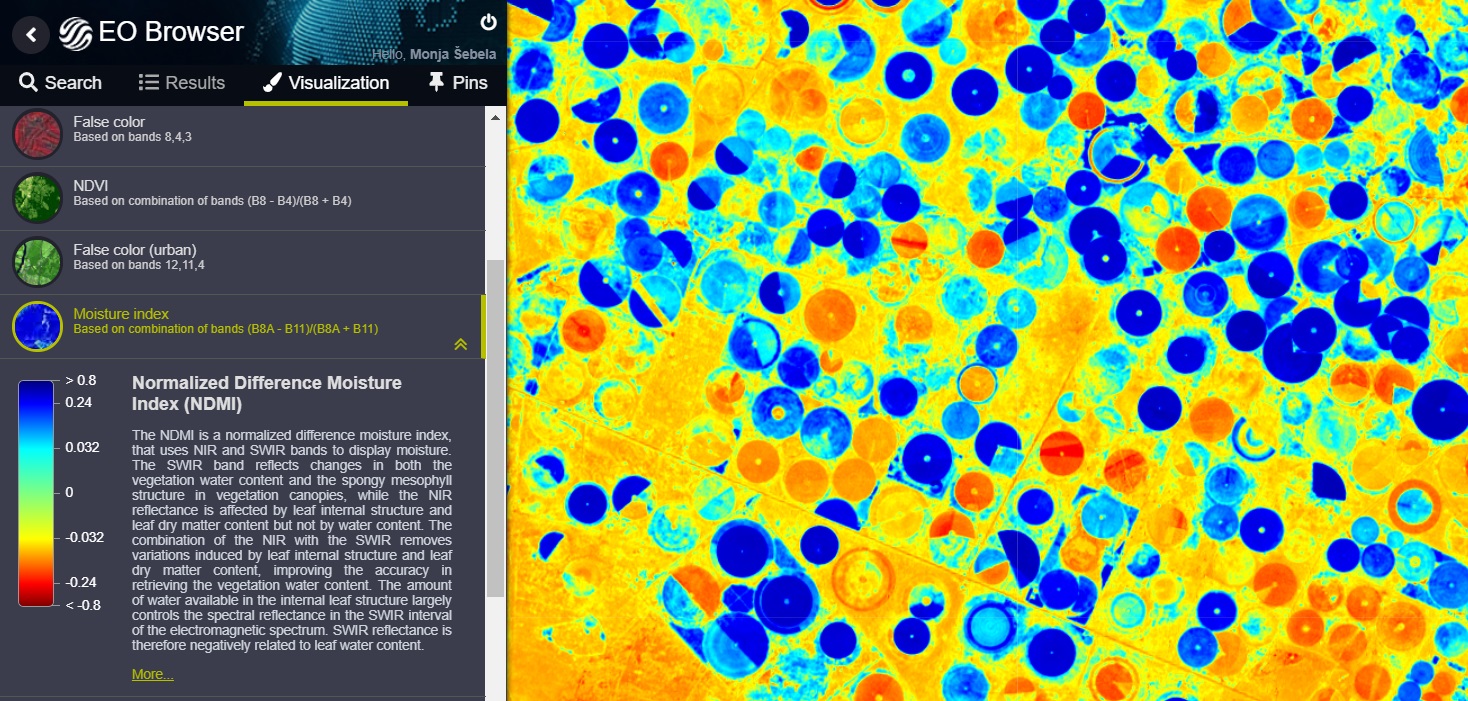
Satelite imagery in EO Browser can be visualized based on user's desired configuration. There are already several visualizations with legends and descriptions prepared for you, such as true color, false color, NDVI, EVI, etc.
By choosing Custom it is possible to choose any combination of bands and make a composite by simply drag and dropping the bands into the RGB channels. On the image below, Danakil Depression has been visualized using SWIR, RED and BLUE bands of Sentinel-2.
The index tool makes it possible to quickly create remote sensing indices and control the visualization, by drag and dropping bands into the equation.
Our custom script functionality is a powerful tool for visualizing satellite data. Using Javascript, you have full control over your visualization, allowing you to make computations, logical operators and conditions, data fusion, multitemporal scripting, etc. You could for example calculate the snow index and display only the pixels you calculated to be snow as blue, and return all the remaining pixels in natural color.
Data fusion makes it possible to combine satellite data collections in a single image, take advantage of each, and bring your scripting to a new level. In this example, you can see Sevastopol area, with cloudy pixels returned in Sentinel-1, which penetrates clouds, and the rest in Sentinel-2 true color. Read more about data fusion in our Medium blog post.
Additionally, you can modify your image by editing the strength of the three color channels, contrast (gain) and luminance (gamma) in the effects pannel.
To make your own visualizations, visit our custom scripts documentation to get started.
Pins and Image Comparison
EO Browser makes it possible for you to save your preffered locations and visualizations as pins, and allows you to share them with others. You can add descriptions to your pins as well, and share them via link, or via a JSON file by exporting it.
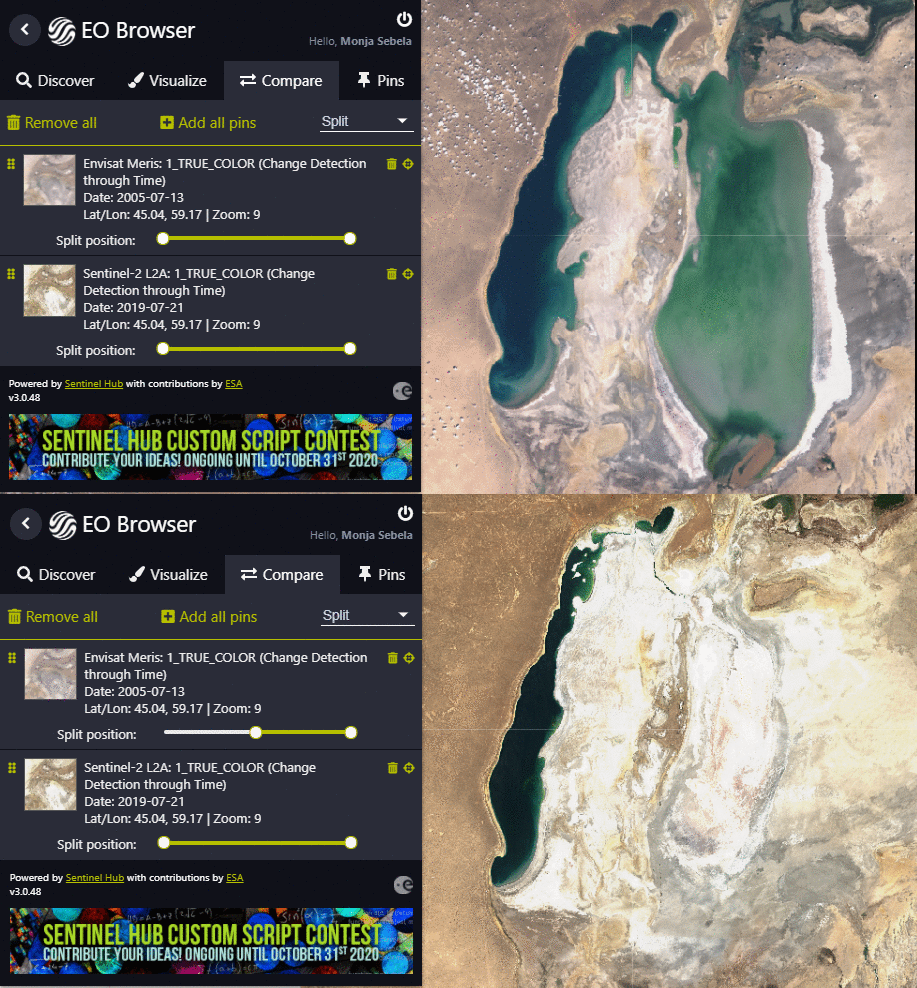
If you would like to compare satellite imagery of an area on different dates or from different data collections, you can do that by adding your pins to the compare pannel, and compare them using split or opacity sliders.
The comparison below displays the striking Aral sea water level reduction from 2005 (ENVISAT) to 2019 (Sentinel-2).
Pin Story Builder
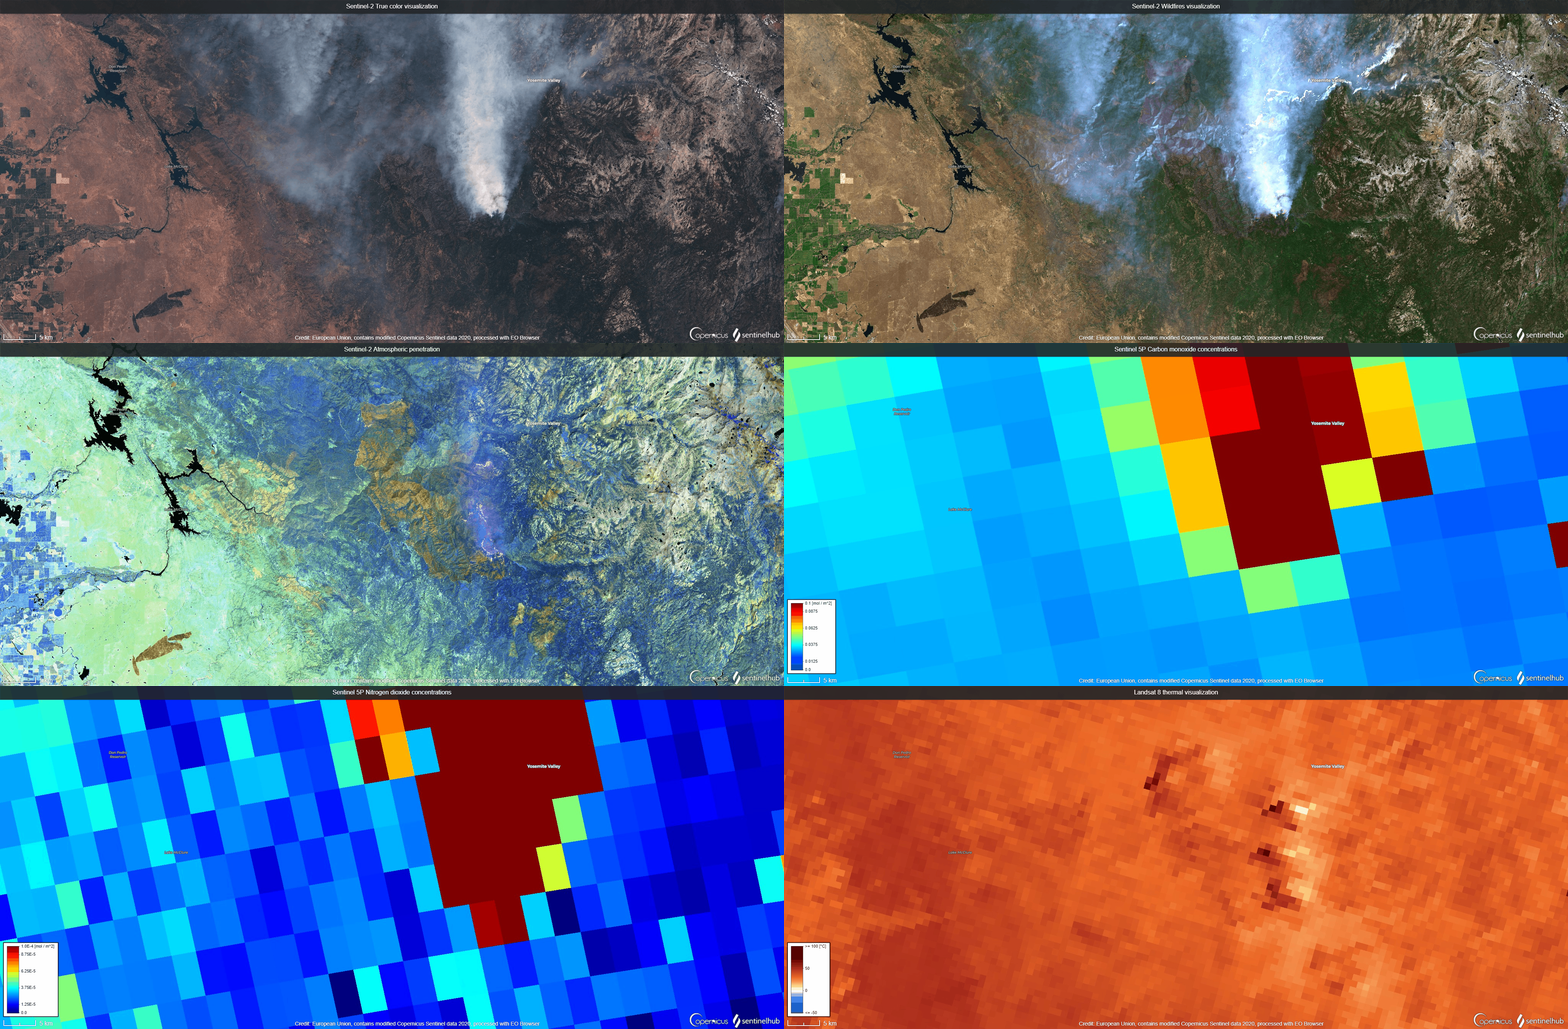
You can quickly create a story of your pins of the same area in our pin story builder.
Below, we have created an example story of the California 2018 wildfires, displaying visualizations from different satellites to study the event. It includes gas concentrations from Sentinel-5P, thermal imagery from Landsat 8 and various visualizations of the fire and burned area from Sentinel-2.
Time-lapse
Time lapse functionality makes it possible for you to create gifs of changes through time. To make a timelapse, go to your area of interest, select your preffered data collection (e.g. Sentinel-2) and visualization setting (e.g. NDVI). Then click on the Create timelapse animation button on the right, where you can choose your time range and select your preffered data frequency. EO Browser will find all the available scenes for the area and present them as “frames”.
You can then preview the time-lapse in the right part of the window. Note that the cloud coverage condition is applied on the full scene level (e.g. 100km x 100km), so there might still be some frames with too many clouds. Just uncheck anomalous frames on the left. Note also that timelapse functionality supports only 300 images at once, so if you need a longer time-frame, select for example a monthly data option.
Below you can see the example timelapse of Shanghai ship traffic, made with a Sentinel-1 custom composite visualization. You can observe the moving ships as time passes.
Read more about time-lapse updates in our Medium blog post.
Statistical Analysis
Outline the area and select the statistical info chart (buttons on the top right). Note that this works only for layers with one output component (e.g. indices, single band products, etc.).
Because of the clouds which get in the way and which distort the NDVI significantly (cloud NDVI values are low) - growth curve is not as orderly as one would have hoped for. Therefore, we have added a simple local area cloud detection algorithm based on the Braaten-Cohen-Yang method (this can be replaced with the L2A scene classification data or some other algorithm) and the result is much nicer. You can also check the numerical values of each point. Statistical information can be exported into a .csv file.
Have you ever wondered how many pixels in your area of interest have the specific value? Now you can find this out in EO Browser directly, by enabling the histogram feature on the right. This is especially useful when doing analysis or creating custom visualizations.
Custom Configurations
In EO Browser, you can display and explore your own configurations with your custom visualization layers, which you can create using our Sentinel Hub Dashboard. Below you can see our personal configuration with two commercial Pleiades data layers.
Image and Data Download
Any image you see on the EO Browser screen, can be downloaded in various file formats. You can download quick PNG or JPG image, selecting whether you want to keep the logo, legend or captions, you can download high resolution imagery, or TIFF data for further analysis.
3D Feature
View Earth observation imagery in 3D! Navigate and even fly through terrain effortlessly, and when done exploring, pin, share or download your visualization. Terrain Viewer has a series of useful tools; using vertical terrain scaling you can make flatter areas appear more dynamic, and you can even simulate the movement of the sun and its projected shadows at any time of day. Using various tools, one can manipulate the accuracy and strength of shadows, and even control the ambient, diffuse, and specular light factors of terrain. Check our blog post, to find out what you can do with it and see some cool examples.
Commercial Data
In EO Browser, you can search, order and visualize commercial high-resolution data all in one place! You can choose between Planet PlanetScope, Planet SkySat Archive, Planetary Variables and Maxar WorldView data. They offer global daily data in high spatial resolution of 0.5 meters (Pleiades, SkySat Archive and WorldView), 1.5 meters (SPOT) and 3 meters (PlanetScope). See how easy it is in the following demonstration video and check the PDF tutorial for step by step instructions.
License
CC BY 4.0 license: Data exported from EO Browser can be used under CC BY 4.0 license. Please mention Sentinel Hub EO Browser along with the relevant data collection in the credits.
Subscribers of Sentinel Hub services can use the license based on the subscription package when it suits them.
In addition to the above the standard terms and licenses of specific data collections (e.g. Landsat, Copernicus, etc.) apply. See "Sentinel Hub Collection Specific Additional Terms" section in Sentinel Hub Terms of Use.
Contact us if special license is required.
Note that timelapse, high resolution image download, pin saving and sharing, story builder and distance measurments are only available if logged in. Explore the capabilities of Planet Insights Platform free of charge for 30-days. No credit-card required. For permanently free exploration of Copernicus Sentinel data we recommend you to explore the Copernicus Data Space Ecosystem.
Open EO Browser Apply for 30-day trial
Read about EO Browser features and updates in our Medium blog posts:
- Timelapse in EO Browser. February 2, 2022
- EO Browser Updates - Summer 2021. August 17, 2021
- Terrain Viewer in EO Browser: A Play of Light and Shadow. June 21, 2021
- EO Browser updates — Summer 2020. July 29, 2020
- New Themes, Multi-Temporal Scripting and Other Improvements in EO Browser. March 12, 2020
- Learning Custom Scripts to make Useful and Beautiful Satellite images. Sep 10, 2019
- Multi-year time series of multi-spectral data viewed and analyzed in Sentinel Hub. April 6, 2018


