Special data offer
In addition to standard Euro Data Cube offer covering complete archives of Sentinel-1, Sentinel-2, Sentinel-3, Sentinel-5P, Landsat 8 and MODIS, Space Apps Challenge partners NASA, ESA and JAXA have prepare a additional data collections, readily available to participants:- OMI/Aura NO2 Cloud-Screened Tropospheric Column by NASA
- Copernicus Sentinel-5P Tropospheric Nitrogen Dioxide
- GCOM-C SGLI by JAXA
- ALOS-2(Sensor:L-band Synthetic Aperture Radar-2/PALSAR-2) by JAXA
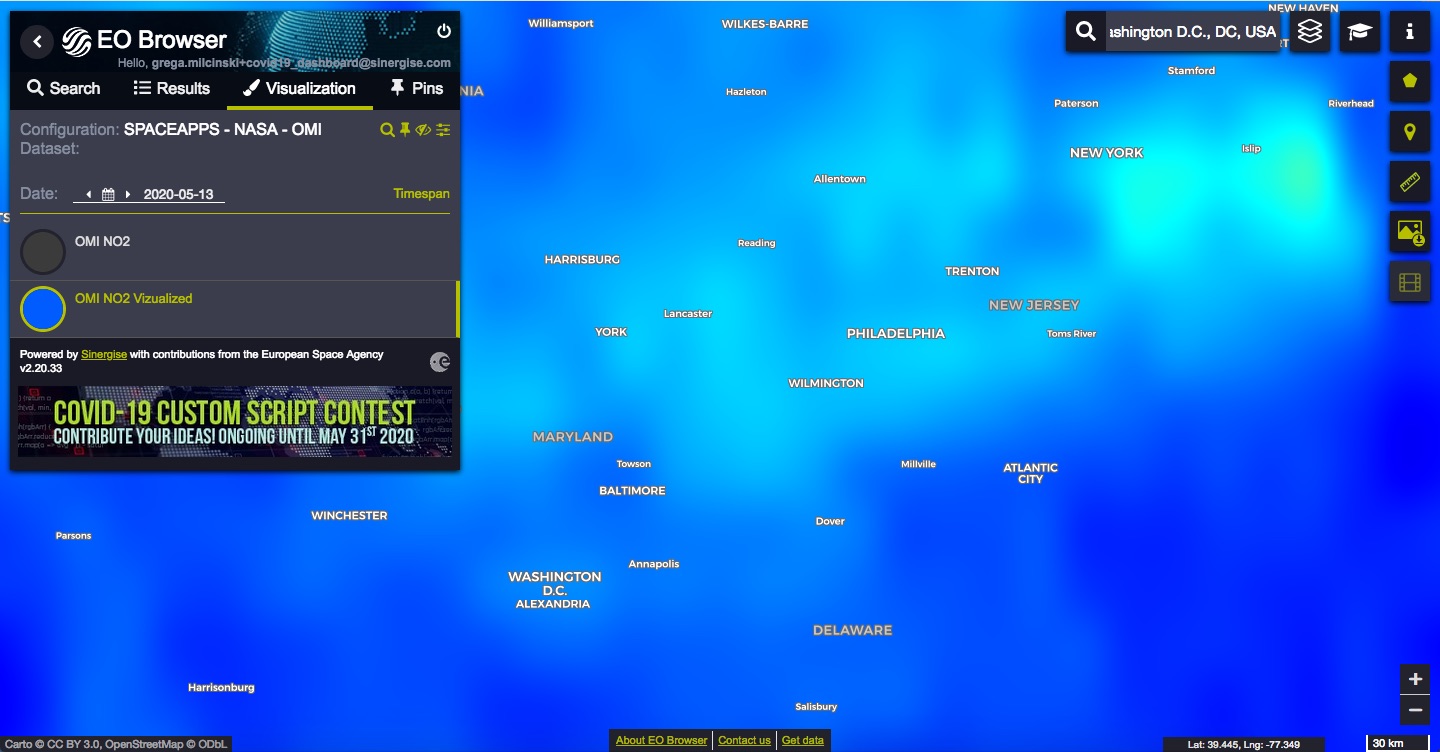
OMI/Aura NO2 Cloud-Screened Tropospheric Column data description
How to access it
- If you do not yet have a Sentinel Hub account, create it here
- Go to Configuration utility
- Click "New Configuration" and find "Space Apps NASA OMI"
- Use EO Browser or OGC services to access these data. You can always reconfigure data processing algorithm in Configuration utility
Description
OMI/Aura NO2 Cloud-Screened Tropospheric Column Global Gridded 0.25 degree x 0.25 degree in Cloud-Optimized GeoTiffNO2 tropospheric column density, screened for CloudFraction < 30% global daily composite at 0.25 degree resolution for the temporal range
January 2004 to May 2020. Original archive data in HDF5 has been processed into a Cloud-Optimized GeoTiff (COG) format.
Quality Assurance: This data has been validated by the NASA Science Team at Goddard Space Flight Center.
Documentation:
- https://disc.gsfc.nasa.gov/datasets/OMNO2d_003/summary
- https://acdisc.gesdisc.eosdis.nasa.gov/data/Aura_OMI_Level3/OMNO2d.003/doc/README.OMNO2.pdf
- Cautionary Note: https://airquality.gsfc.nasa.gov/caution-interpretation
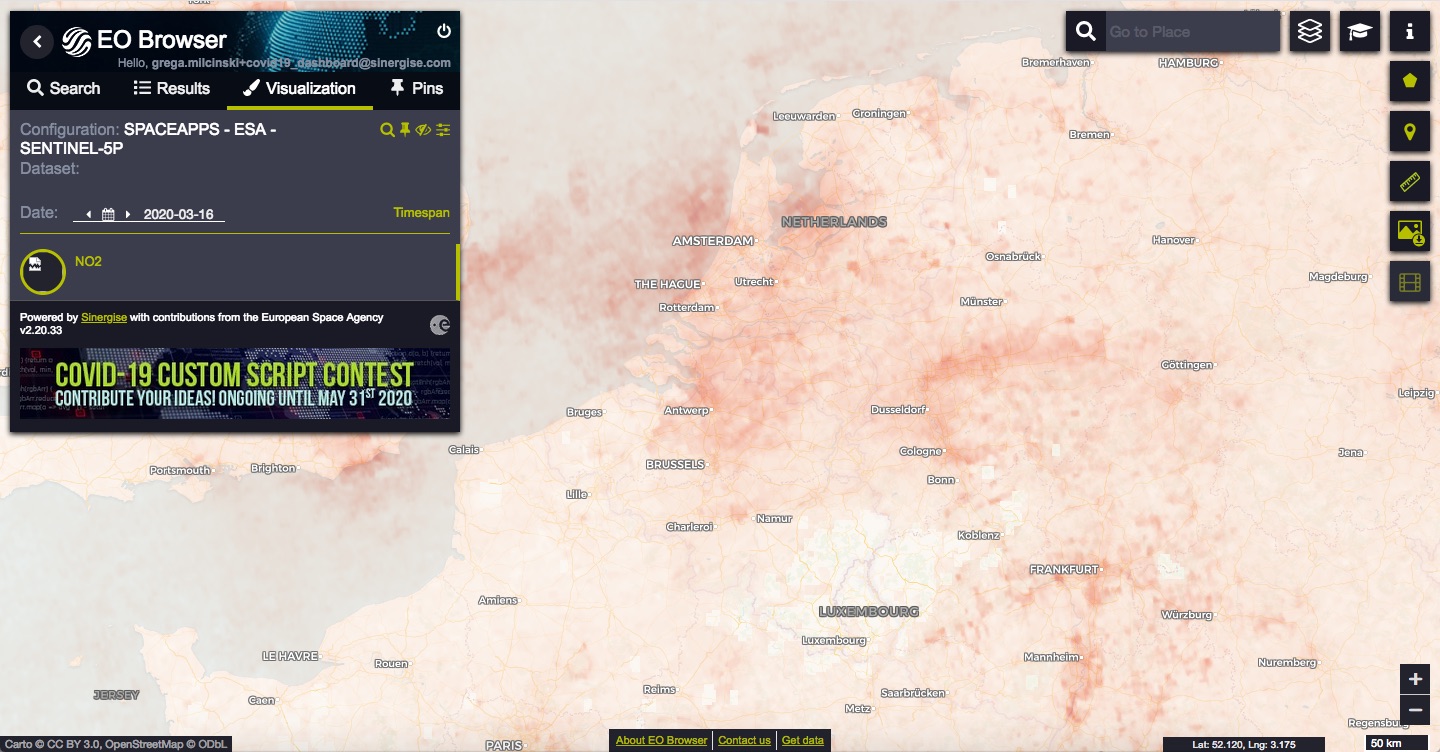
Copernicus Sentinel-5P Tropospheric Nitrogen Dioxide data description
How to access it
- If you do not yet have a Sentinel Hub account, create it here
- Go to Configuration utility
- Click "New Configuration" and find "Space Apps Sentinel-5P NO2"
- Use EO Browser or OGC services to access these data. You can always reconfigure data processing algorithm in Configuration utility
Description
The maps shows 14 days averages of tropospheric Copernicus Sentinel-5 Precursor Nitrogen Dioxide measurements. Concentrations of short-lived pollutants, such as Nitrogen Dioxide, are indicators of changes in economic slowdowns and are comparable to changes in emissions. Using a 14 day average eliminates some effects which are caused by short term weather changes and clouds cover. The average gives a view over the whole time period and therefore reflects trends better than shorter time periods.Further information
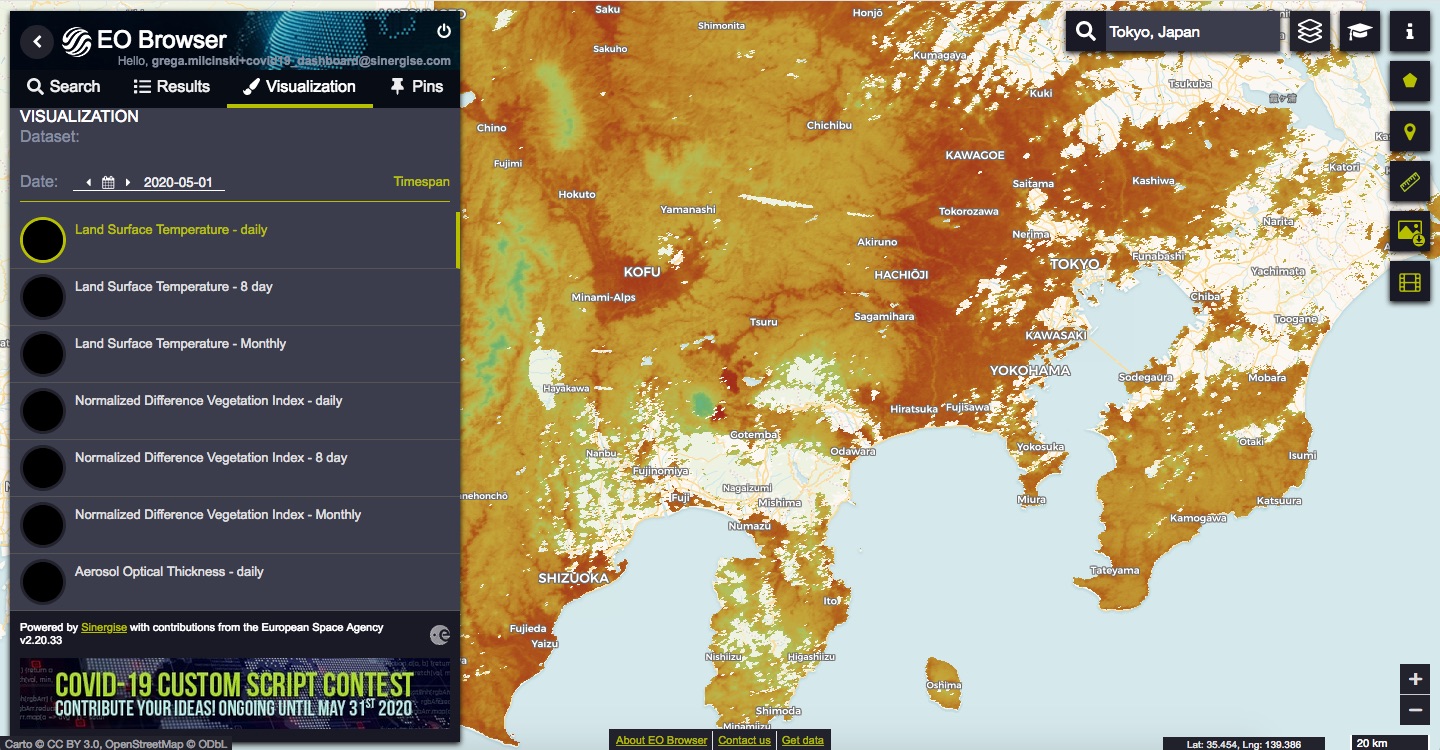
JAXA GCOM-C SGLI data description
How to access it
- If you do not yet have a Sentinel Hub account, create it here
- Go to Configuration utility
- Click "New Configuration" and find "Space Apps - JAXA - GCOM-C" and "Space Apps - JAXA - GCOM-C - visualization:
- Use EO Browser or OGC services to access these data. You can always reconfigure data processing algorithm in Configuration utility
Description
Area/Time Coverage
Data was processed for the following areas and is provided for Jan ~ April (4 month) in 3 years (2018 ~ 2020).
| LN | Area | Latitude | Longitude |
|---|---|---|---|
| 1 | Tokyo | N34.3 ~ N36.3 | E138.0 ~ E141.0 |
| 2 | Beijing | N39.1 ~ N41.1 | E115.0 ~ E118.0 |
| 3 | California | N34.5 ~ N40.5 | W125.0 ~ W118.0 |
| 4 | Frankfurt | N49.0 ~ N52.0 | E7.5 ~ E10.5 |
| 5 | Dunkerque,Ghent | N50.0 ~ N52.0 | E1.0 ~ E5.0 |
Product type
The following table lists all the available product types. The CRS(Coordinate Reference System) used is WPSG:4236. Original data in HDF (check the references below) is converted into the CRS/COG format. GCOM-C observes 2 times in a day (Descending : around 10:30 in local sun time, Ascending : around 22:30 in local sun time).
| LN | Product | Definition | Unit | Resolution |
|---|---|---|---|---|
| 1 | ARNP (Daily) | Aerosol Optical Thickness | Dimensionless | 1/120 deg |
| 2 | LST (Daily, 8-day, Monthly) | Land Surface Temperature (A: Ascending (Night), D: Descending (Daytime)) | Kelvin | 1/480 deg |
| 3 | NDVI (Daily, Monthly) | Normalized Difference Vegetation Index | Dimensionless | 1/480 deg |
Configuration Layers
| LN | Product type | Layer ID | Description |
|---|---|---|---|
| 1 | LST (Daily) | 1-LAND-SURFACE-TEMPERATURE-DAILY | Daily land surface temperature, visualized |
| 2 | LST (Daily) | LAND-SURFACE-TEMPERATURE-DAILY-VALUE | Daily land surface temperature, single value |
| 3 | LST (8-day) | 2-LAND-SURFACE-TEMPERATURE-8-DAY | Land surface temperature, visualized, every 8 days |
| 4 | LST (8-day) | 92-LAND-SURFACE-TEMPERATURE-8-DAY-VALUE | Land surface temperature, single value, every 8 days |
| 5 | LST (Monthly) | 3-LAND-SURFACE-TEMPERATURE-MONTHLY | Monthly land surface temperature, visualized |
| 6 | LST (Monthly) | LAND-SURFACE-TEMPERATURE-MONTHLY-VALUE | Monthly land surface temperature, single value |
| 7 | NDVI (Daily) | 4-NORMALIZED-DIFFERENCE-VEGETATION-INDEX-DAILY | Daily normalized difference vegetation index, visualized |
| 8 | NDVI (Daily) | NORMALIZED-DIFFERENCE-VEGETATION-INDEX-DAILY-VALUE | Daily normalized difference vegetation index, single-value |
| 9 | NDVI (Monthly) | 6-NORMALIZED-DIFFERENCE-VEGETATION-INDEX-MONTHLY | Monthly normalized difference vegetation index, visualized |
| 10 | NDVI (Monthly) | NORMALIZED-DIFFERENCE-VEGETATION-INDEX-MONTHLY-VALUE | Monthly normalized difference vegetation index, single-value |
| 11 | ARNP (Daily) | 7-AEROSOL-OPTICAL-THICKNESS-DAILY | Daily aerosol optical thickness over Land at 500nm by Non-polarization, visualized |
| 12 | ARNP (Daily) | AEROSOL-OPTICAL-THICKNESS-DAILY-VALUE | Daily aerosol optical thickness over Land at 500nm by Non-polarization, single value |
References
- JAXA G-portal : Data distribution system
- GCOM-C SGLI Standard products
- GCOM-C “SHIKISAI” Data users Hand book
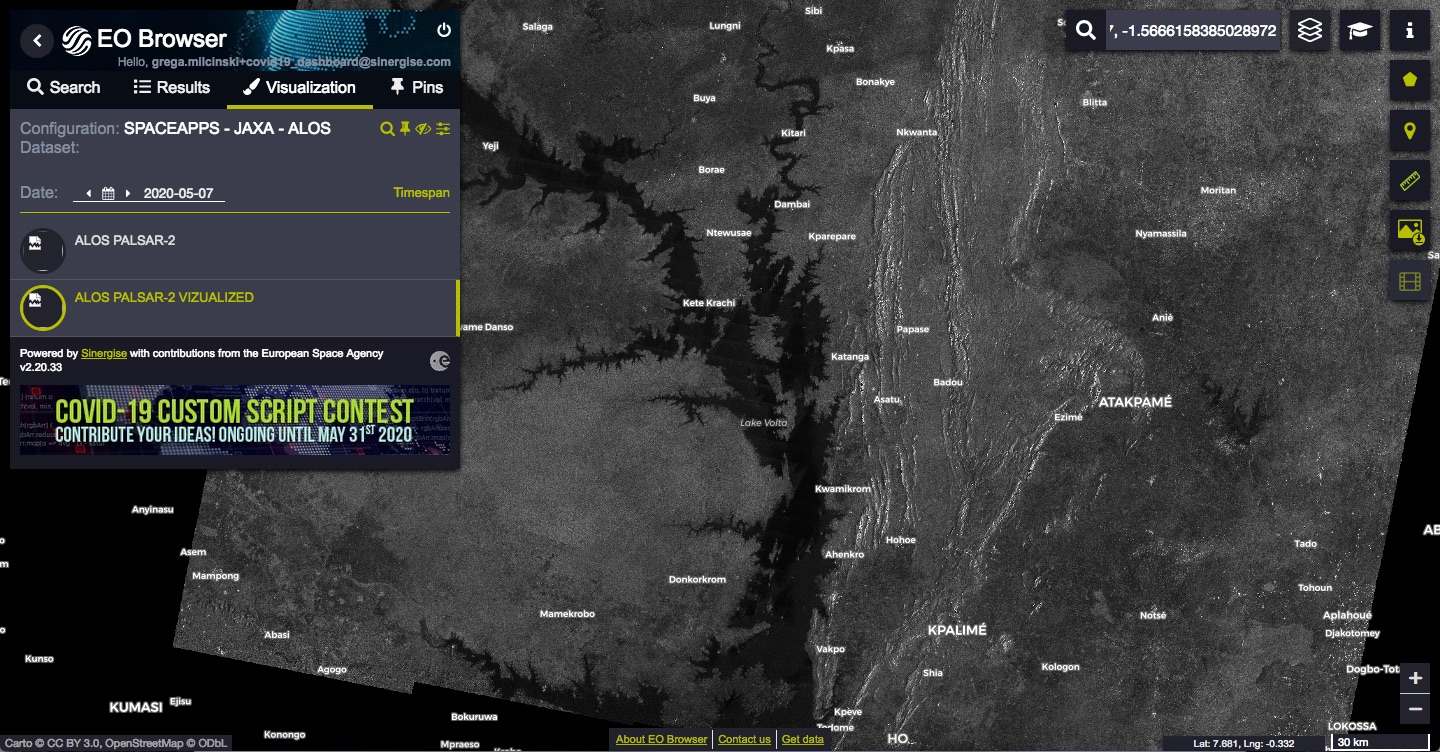
ALOS-2(Sensor:L-band Synthetic Aperture Radar-2/PALSAR-2) data description
How to access it
- If you do not yet have a Sentinel Hub account, create it here
- JAXA's data are not open and free data but are made available for free for this hackathon. Please read the end-user license.
- Fill this form.
- JAXA's configuration will be added to your account latest in a few hours
- Go to Configuration utility
- Use EO Browser or OGC services to access these data. You can always reconfigure data processing algorithm in Configuration utility
Description
The PALSAR-2 aboard the ALOS-2 is a Synthetic Aperture Radar (SAR), which emits microwave and receives the reflection from the ground to acquire information. Since it does not need other sources of light such as the sun, SAR has the advantage of providing satellite images regardless day or night. The frequency of transmitting and receiving microwave is L-band, which is less affected by clouds and rains. This all-weather observing capability is suitable for monitoring disasters rapidly. In addition, L-band microwave can reach to the ground partially penetrating through vegetation to obtain information of vegetation and ground surface.Further information